
Volume Profile · StarPentaPlus
Volume Profile design and optimizations
Paint-path notes: keep 1-tick math, draw less, and let fill survive a compressed scale.
I have been spending time on Volume Profile paint cost, and on what the histogram actually looks like once the price axis is compressed. The calculation can stay on a 1-tick ladder. POC, value area, and bucket volumes do not have to change. What I am talking about here is only how those ticks are drawn.
ACSIL maps price to screen with sc.RegionValueToYPixelCoordinate. That mapping is many-to-one as soon as a tick is smaller than a pixel. At that point you can still compute every tick, but you cannot show every tick as its own rectangle. Borders on a 1–2 px row stop being outlines and become the whole row. If you still issue a fill (and a border) for every VAP level, a lot of that GDI never makes it to a unique pixel.
Two changes have worked well for me. They are small, they are measurable, and they do not require coarsening the profile. They ship in the StarPenta Volume Profile.
Visuals
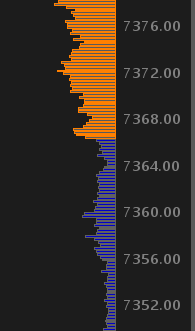
1. Borders and fill, value area readable
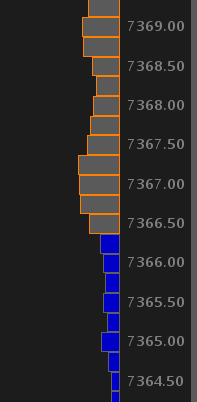
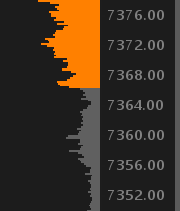
This is the usual expanded scale. Fill is inside/outside the value area, orange borders sit on the fill, and each tick is still a real rectangle.
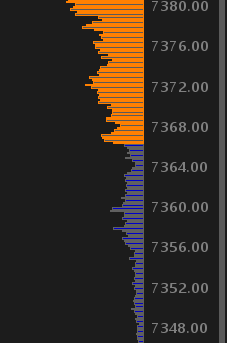
2. Compressed: borders eat the fill
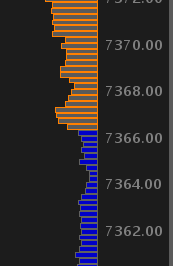
Same study, price axis squeezed. Each tick row is only a few pixels tall, sometimes one. A 1 px border on every row lands on the same pixels as its neighbors. What you see is a solid patch of border color. The fill is gone.
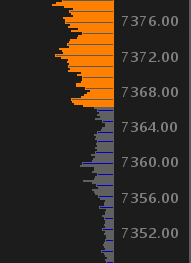
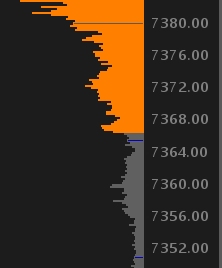
3. Progression: tighter scale, more shared Y
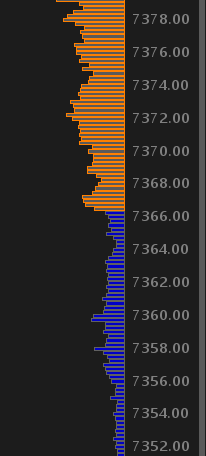
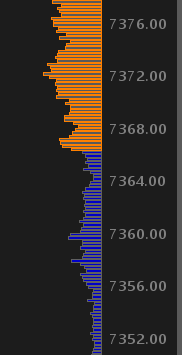
Stepping the same idea tighter. Borders stack, and colors start to flip at similar prices, because neighboring ticks share a RegionValueToYPixelCoordinate.
10. Three prices, one yy
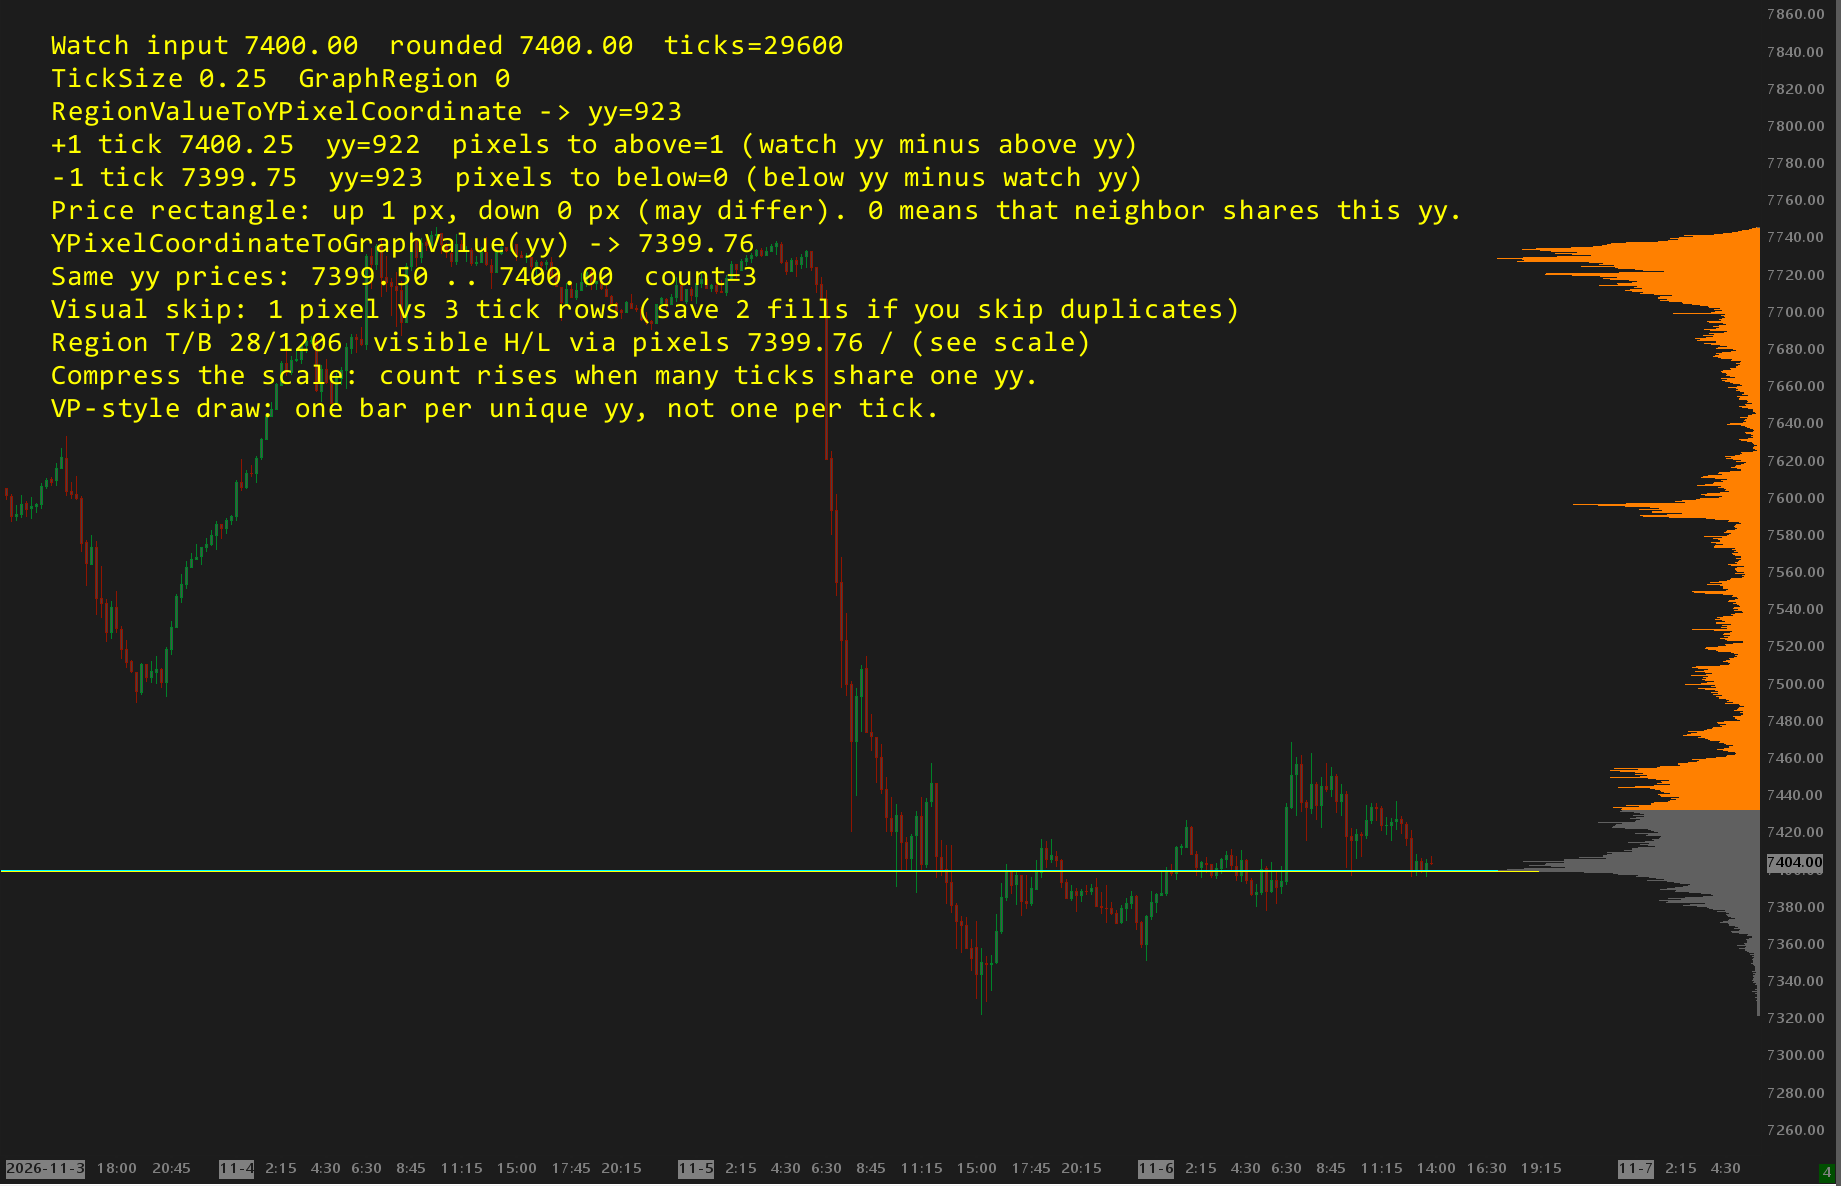
I pointed a small helper study at 7400.00 on a 0.25 tick chart and asked ACSIL for the Y of that price, then walked one tick up and one tick down. RegionValueToYPixelCoordinate returned yy=923. The same pixel also maps 7399.50 through 7400.00 — three prices.
If every tick is drawn, that row is painted three times. Two of those fills cannot show. That is a 66% efficiency loss on that row alone, before you count borders. Across a compressed profile this is normal, not a freak scale.
At this zoom, +1 tick is 1 px above and −1 tick shares this yy (pixels to below = 0). A “price rectangle” is 0–1 px tall. A border on that row is not an outline. It is the row.
1. Skip borders when the row is thin
If the volume rectangle is shorter than a few pixels, I do not draw the border. The cutoff I used is 5 px.
On a 1–3 px row, a 1 px stroke on two or four edges is most of the rectangle. Stack a hundred of those and the profile becomes a border-colored smear, which is what you see above. The fill you chose for value area vs outside never gets a chance to read.
If you skip the border and draw fill only, the compressed profile still looks like a Volume Profile: VA color vs outside color. Borders come back when the row is tall enough that an outline is actually an outline.
A typical chart might show on the order of 100 ticks. That is 100 border passes you can simply not issue. If each row was fill plus border, that is roughly half the rectangle GDI.
2. Draw longest first; skip later rows on the same Y
Once the scale is tight, several VAP levels hash to the same pixel row. The helper shot is the measured case: three prices, one yy.
I do not know Sierra’s paint order, and I do not need to. If every level is drawn, a shorter bar at that Y is either buried or it flickers over the longer one as the last bar updates. The only bar you can actually see at that coordinate is the longest one.
So I walk buckets longest width first, remember which Y pixels are already filled, and skip any shorter bar that would land on a Y I have already painted.
That also means you do not have to draw POC last in order to “keep it on top.” If POC is the longest bar at that Y, it wins because it went first. If some other bar at the same pixel is longer, that longer bar would cover POC anyway.
A lot of people (myself included) still want 1-tick compression in the calculation, so POC and VA stay on the real ladder. This skip does not touch that. You still compute on ticks. You just do not call FillRectangle for a row that cannot appear.
The bookkeeping is cheap. The visible price range on a chart is small, so “have I already drawn this yy?” is a short scan or a small set.
On this Volume Profile, that landed in the 3×–5× range for GDI fills. In some cases the study used fewer clock cycles than Sierra’s VP, measured with a wrapper study that times the study call over a set aggregation period. That number is study-call time; GDI sits on top of it, which is why skipping invisible rectangles still matters.
At three ticks per pixel, drawing all three is already a 66% loss on that row, and that is before borders.
None of this asks for a coarser bucket so the math matches pixels, and none of it depends on undocumented Sierra internals. RegionValueToYPixelCoordinate is enough: many prices, one yy. VA adjacency and empty-price rules in the calculation can stay as they are.
When the row is under about 5 px, fill only. When several ticks share a yy, draw the longest and skip the rest. Same profile the user configured, less GDI, and the fill color survives compression.
In closing
I like this kind of work: measure the ACSIL mapping, draw less, keep the math honest. If you want to poke at the histogram yourself, the StarPenta Volume Profile has a trial.
If you have a Sierra study that is spending its life in GDI, or you want this level of pass on something you already ship, I do that. Same for other software that has gotten slow or stuck. StarPenta for Chart; Cherry Valley Consulting if it is a broader problem. [email protected] is a fine place to start.